Create a Real Time Interactive Dashboard for Office 365 Using PowerShell Universal Dashboard
Table of Contents
If you have never heard of PowerShell Universal Dashboard you need to head on over to PoshUD right now and check out this awesome PowerShell Module. Using PowerShell Core, Material Design, ReactJS and ASP.NET Core, Universal Dashboard takes advantage of cutting-edge technology to provide cross-platform, cross-device dashboards that looks sleek and modern.1
While reading over some other posts about what other people have done with PowerShell Universal Dashboard, I wondered if there was a way to create a interactive dashboard that would hook into Office 365 and gather data from it. At first, I attempted to create a dashboard that would create a PSSession to Office 365 but it presented some problems and overall was quite slow. I then decided to use the Microsoft Graph REST API to connect to Office 365. This allows it to refresh the data within in the dashboard quickly and takes seconds to connect.
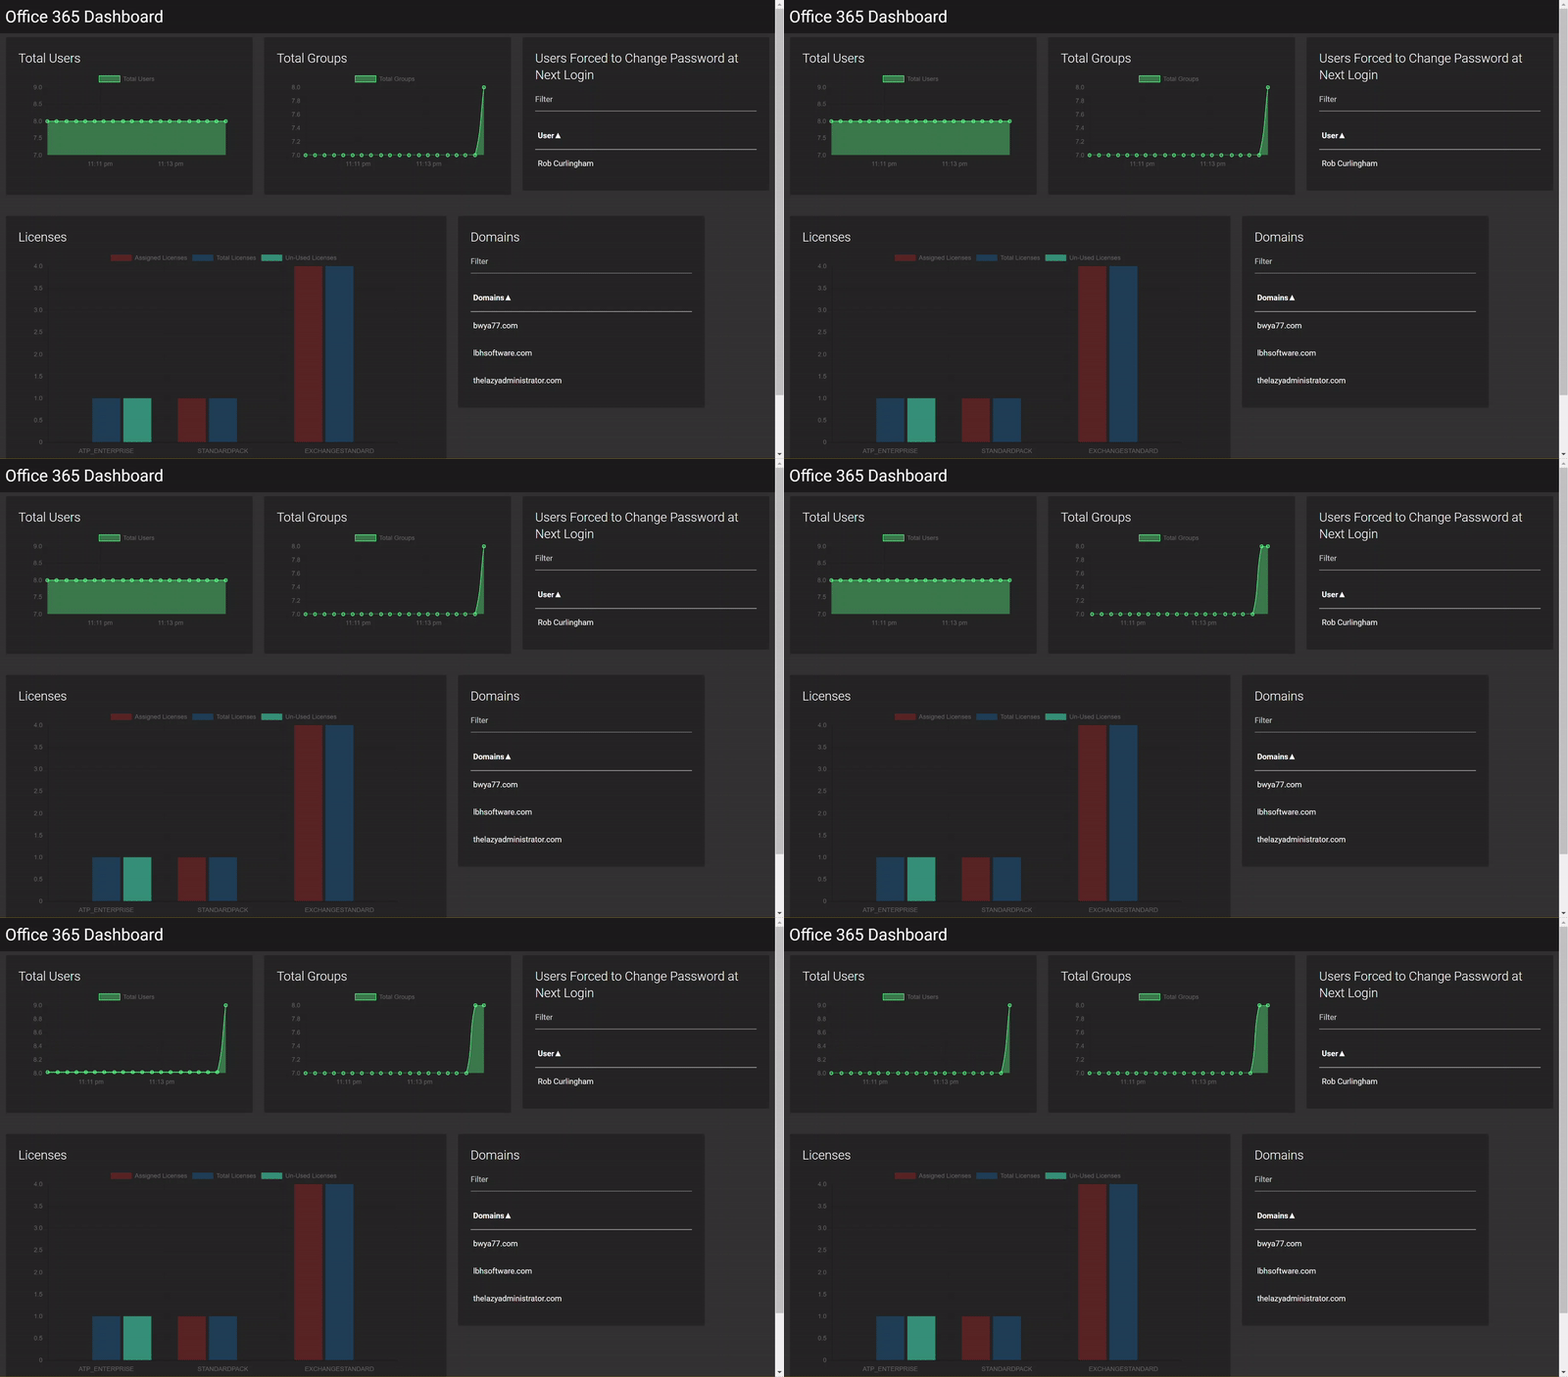
One of the great things about PowerShell Universal Dashboard is you can specify refresh amounts for each data set. You can make it refresh less often, or more often, whichever fits your needs. While running my dashboard I added users and created new groups (as you can see from the graph), but I also made users change their passwords at next logon, and several seconds later I saw their account name on the dashboard. When I changed licenses, I saw the license graph change as well. One thing I wanted to add to this dashboard was a “un-used license” value, which shows me licenses that I am paying for but are not assigned to anything. This allows me to make sure I clean up licenses in my tenant so I’m not paying for a license that’s not in use.

Pre-Requisites
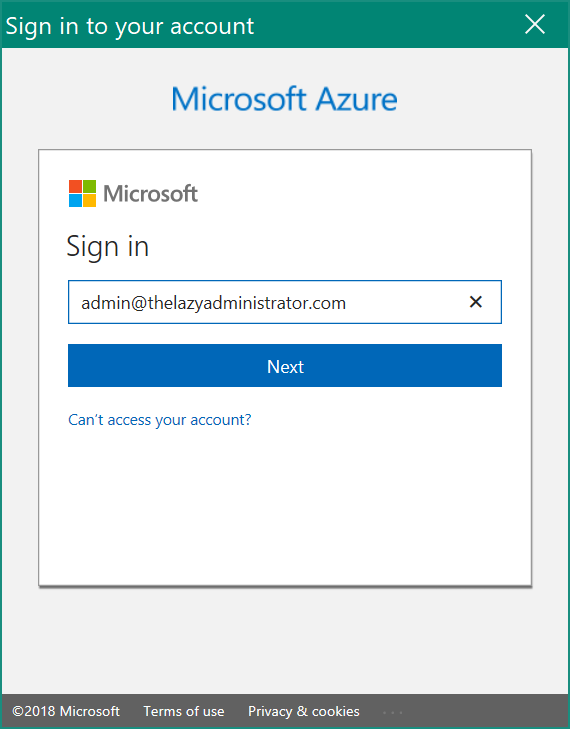
I followed the following guide to connect to the Microsoft Graph API.
- Download/copy the New-GraphToken function
- The only thing we need is our Office 365 tenant name, in my case its bwya77.onmicrosoft.com
- The Function requires the module AzureRM, to install it simply run:
Install-Module AzureRM
- PowerShell Universal Dashboard module, to install it simply run:
Install-Module UniversalDashboard
The tenant name will be stored in a variable called $TenantName
$TenantName = "bwya77.onmicrosoft.com"
As we see pictured above I added the New-GraphToken function to the beginning of my script, and then added my tenant to the TenantName variable. My next step is to request a Graph token which is then stored in a variable called GraphToken.
New-GraphToken Function:
Function New-GraphToken {
    #Requires -Module AzureRM
    [CmdletBinding()]
    Param(
        $TenantName = 'ItForDummies.net'
    )

    try{
        Import-Module AzureRM -ErrorAction Stop
    }
    catch{
        Write-Error 'Can''t load AzureRM module.'
        break
    }

    $clientId = "1950a258-227b-4e31-a9cf-717495945fc2" #PowerShell ClientID
    $redirectUri = "urn:ietf:wg:oauth:2.0:oob"
    $resourceAppIdURI = "https://graph.windows.net"
    $authority = "https://login.windows.net/$TenantName"
    $authContext = New-Object "Microsoft.IdentityModel.Clients.ActiveDirectory.AuthenticationContext" -ArgumentList $authority
    #$authResult = $authContext.AcquireToken($resourceAppIdURI, $clientId,$redirectUri, "Auto")
    $authResult = $authContext.AcquireToken($resourceAppIdURI, $clientId,$redirectUri, "Always")

    @{
       'Content-Type'='application\json'
       'Authorization'=$authResult.CreateAuthorizationHeader()
    }
}

Creating and Customizing the Dashboard
Creating the dashboard took me a little bit of time. I tested with a lot of different component types, data sets, and groupings. PowerShell Universal Dashboard has quite a bit of customization options and also a little bit of a learning curve, but once you get the hang of things you will be making dashboards quickly and easily.
I did a lot of testing and customization off of Adam’s sample dashboard code which is hosted on GitHub. I recommend you first start off playing around with it and the test data.
If we take a look of my formatting, you can see I have two rows for my dashboard. The first row contains 3 columns, and my second row contains 2 columns. The “Total Users” component, and the “Total Groups” is a UDMonitor, while the “Domains” and “Users Forced to Change Password at Next Logon” is a UDGrid. The “License” component is a UDChart. UDMonitor, UDGrid and UDChart are all components. Dashboards are composed of components. some components can be:
- UDChart
- UDColumn
- UDGrid
- UDInput
- UDMonitor
- UDLayout
- UDPage
- UDTable
- UDRow
Interactive Dashboard
The dashboard will allow you to interact with it. As we see pictured below, I can hover over different components to get more info on the data set. In the Domains component I can even filter my results.
Data Sets
In my Dashboard I wanted to display information about Users, Groups, Licenses, and Domains. The Microsoft Graph API connects to the data that drives productivity – mail, calendar, contacts, documents, directory, devices, and more so this dashboard just scratches the surface. My “Total Users” component monitors the total user count in my tenant, similar to “Total Groups”. The “Licenses” Component displays each license type and its assigned count, total count, and un-assigned count. “Domains” displays all my verified domains, dropping the default “.onmicrosoft” sub-domain. And lastly, the “Users Forced to Change Password at Next Logon” component parses all users, and grabs those that are required to change their password at next logon. Since I made this dashboard fairly quickly, I plan to keep adding different data sets to it to really make this dashboard valuable. In the future I hope to monitor spam flow, mail flow, and more.
Help
To learn more about PowerShell Universal Dashboard I urge you to read Adam’s GitHub gitbook
Price
Universal Dashboard is currently $99 which is a bargain since Adam keeps updating it with great features. It will allow you to use it for an hour unpaid as you trial it. The pricing can be found here.
PowerShell Script
Function New-GraphToken
{
	#Requires -Module AzureRM
	[CmdletBinding()]
	Param (
		$TenantName = 'bwya77.onmicrosoft.com'
	)

	try
	{
		Import-Module AzureRM -ErrorAction Stop
	}
	catch
	{
		Write-Error 'Can''t load AzureRM module.'
		break
	}

	$clientId = "1950a258-227b-4e31-a9cf-717495945fc2" #PowerShell ClientID
	$redirectUri = "urn:ietf:wg:oauth:2.0:oob"
	$resourceAppIdURI = "https://graph.windows.net"
	$authority = "https://login.windows.net/$TenantName"
	$authContext = New-Object "Microsoft.IdentityModel.Clients.ActiveDirectory.AuthenticationContext" -ArgumentList $authority
	#$authResult = $authContext.AcquireToken($resourceAppIdURI, $clientId,$redirectUri, "Auto")
	$authResult = $authContext.AcquireToken($resourceAppIdURI, $clientId, $redirectUri, "Always")

	@{
		'Content-Type'	      = 'application\json'
		'Authorization'	      = $authResult.CreateAuthorizationHeader()
	}
}

$TenantName = "bwya77.onmicrosoft.com"
$GraphToken = New-GraphToken -TenantName $TenantName

$Colors = @{
	BackgroundColor   = "#FF252525"
	FontColor		  = "#FFFFFFFF"
}

$NavBarLinks = @((New-UDLink -Text "<i class='material-icons' style='display:inline;padding-right:5px'>favorite_border</i> PowerShell Pro Tools" -Url "https://poshtools.com/buy-powershell-pro-tools/"),
	(New-UDLink -Text "<i class='material-icons' style='display:inline;padding-right:5px'>description</i> Documentation" -Url "https://adamdriscoll.gitbooks.io/powershell-tools-documentation/content/powershell-pro-tools-documentation/about-universal-dashboard.html"))


Start-UDDashboard -Wait -Port 8081 -Content {
	New-UDDashboard -NavbarLinks $NavBarLinks -Title "Office 365 Dashboard" -NavBarColor '#FF1c1c1c' -NavBarFontColor "#FF55b3ff" -BackgroundColor "#FF333333" -FontColor "#FFFFFFF" -Content {
		New-UDRow{
			New-UDColumn -Size 4 {
				New-UDMonitor -Title "Total Users" -Type Line -DataPointHistory 20 -RefreshInterval 15 -ChartBackgroundColor '#5955FF90' -ChartBorderColor '#FF55FF90' @Colors -Endpoint {
					(Invoke-RestMethod -Uri "https://graph.windows.net/$TenantName/users/?api-version=1.6" -Headers $GraphToken -Method Get | Select-Object -ExpandProperty Value).Count | Out-UDMonitorData
				}
			}
			New-UDColumn -Size 4 {
				New-UDMonitor -Title "Total Groups" -Type Line -DataPointHistory 20 -RefreshInterval 15 -ChartBackgroundColor '#5955FF90' -ChartBorderColor '#FF55FF90' @Colors -Endpoint {
					(Invoke-RestMethod -Uri "https://graph.windows.net/$TenantName/groups/?api-version=1.6" -Headers $GraphToken -Method Get | Select-Object -ExpandProperty Value).Count | Out-UDMonitorData
				}
			}
			New-UDColumn -Size 4 {
				New-UDGrid -Title "Users Forced to Change Password at Next Login" @Colors -Headers @("User") -Properties @("User") -AutoRefresh -RefreshInterval 20 -Endpoint {
					$PWUsers = Invoke-RestMethod -Uri "https://graph.windows.net/$TenantName/users/?api-version=1.6" -Headers $GraphToken -Method Get | Select-Object -ExpandProperty Value | Where-Object { $_.passwordProfile -like "*forceChangePasswordNextLogin=True*" }
					$UserData = @();
					foreach ($PWUser in $PWUsers)
					{
						$UserData += [PSCustomObject]@{ "User" = ($PWUser).displayName }
					}
					$UserData | Out-UDGridData
				}
			}
		}
		New-UDRow{
			New-UDColumn -Size 7{
				New-UdChart -Title "Licenses" -Type Bar -AutoRefresh -RefreshInterval 7 @Colors -Endpoint {
					$Licenses = Invoke-RestMethod -Uri "https://graph.windows.net/$TenantName/subscribedSkus/?api-version=1.6" -Headers $GraphToken -Method Get | Select-Object -ExpandProperty Value | Select-Object SkuPartNumber, ConsumedUnits -ExpandProperty PrepaidUnits | Where-Object { $_.enabled -lt 10000 }
					$LicenseData = @();
					foreach ($License in $Licenses)
					{
						$Overage = (($License).enabled) - (($License).consumedUnits)
						$LicenseData += [PSCustomObject]@{ "License" = ($License).skuPartNumber; "ConsumedUnits" = ($License).consumedUnits; "EnabledUnits" = ($License).enabled; "UnUsed" = $Overage }
					}

					$LicenseData | Out-UDChartData -LabelProperty "License" -Dataset @(
						New-UdChartDataset -DataProperty "ConsumedUnits" -Label "Assigned Licenses" -BackgroundColor "#80962F23" -HoverBackgroundColor "#80962F23"
						New-UdChartDataset -DataProperty "EnabledUnits" -Label "Total Licenses" -BackgroundColor "#8014558C" -HoverBackgroundColor "#8014558C"
						New-UDChartDataset -DataProperty "UnUsed" -Label "Un-Used Licenses" -BackgroundColor "#803AE8CE" -HoverBackgroundColor "#803AE8CE"
					)
				}
			}
			New-UDColumn -Size 4{
				New-UDGrid -Title "Domains" @Colors -Headers @("Domains") -Properties @("Domains") -AutoRefresh -RefreshInterval 20 -Endpoint {
					$Domains = Invoke-RestMethod -Uri "https://graph.windows.net/$TenantName/domains/?api-version=1.6" -Headers $GraphToken -Method Get | Select-Object -ExpandProperty Value | Where-Object { $_.name -notlike "*onmicrosoft.com*" }
					$Domaindata = @();
					foreach ($Domain in $Domains)
					{
						$DomainData += [PSCustomObject]@{ "Domains" = ($Domain).name }
					}
					$DomainData | Out-UDGridData
				}
			}
		}
	}
}
Sources
1 – https://www.poshud.com/Home

My name is Bradley Wyatt; I am a 5x Microsoft Most Valuable Professional (MVP) in Microsoft Azure and Microsoft 365. I have given talks at many different conferences, user groups, and companies throughout the United States, ranging from PowerShell to DevOps Security best practices, and I am the 2022 North American Outstanding Contribution to the Microsoft Community winner.


6 thoughts on “Create a Real Time Interactive Dashboard for Office 365 Using PowerShell Universal Dashboard”
Do you think there is a way to pull all data for every tenant in your partner portal?
Would be awesome to use this to aggregate data across all your clients?
This is something I want to investigate more into. I think it would be very valuable to make a graph that can report on multiple tenants easily.
Hey
Do you think this same sort of dashboard would be doable using PowerBI?
Thanks
Scott
I haven’t looked into PowerBI much so I can’t speak on it, but it sounds like a good thing for me to look over and make a write up about. I would assume PowerBI can make similar graphs for you.
Start-UDDashboard is throwing an error. what are the prerequistes other than .net 4.7
error: Start-UDDashboard : Error -4092 EACCES permission denied
I would reach out to Adam who is the developer for any issues. He is very helpful https://legacy.gitbook.com/@adamdriscoll